Excel & Power BI
Production data is most valuable next to the rest of the business: the order value from the ERP, the energy bill, the shift planning. That analysis usually happens in Excel or Power BI, not in a dashboard.
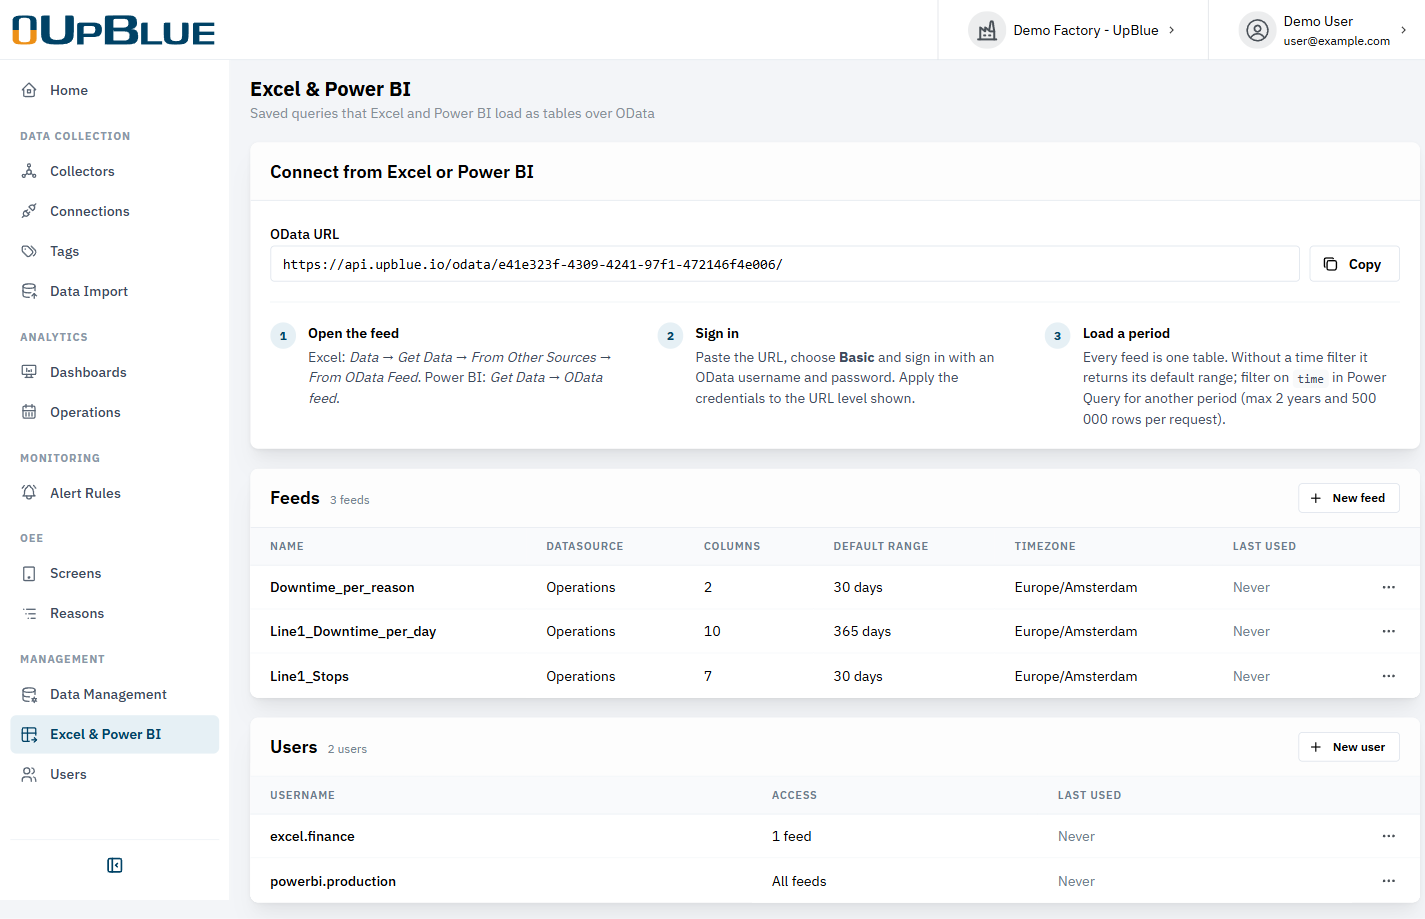
The Excel & Power BI page makes UpBlue data available as a live, refreshable table in both tools. No exports, no copy-paste, no code: you click Refresh in Excel and the latest production data is there.
It works with the standard OData feed connector that is built into Excel and Power BI.
How it works
- A feed is a saved query. You build it with the same query editor as a dashboard panel: pick tags, aggregation, buckets and math, or use the Operations datasource for one row per production run.
- Every feed becomes one table in Excel or Power BI. The feed name is the table name.
- An OData user is a username and password that Excel or Power BI signs in with. You decide per user which feeds it may read.
- The query runs every time the workbook refreshes, so the data is always current.
Feeds and OData users are managed per organisation, by editors and admins.
Create a feed
Open the page
Go to the Excel & Power BI page.
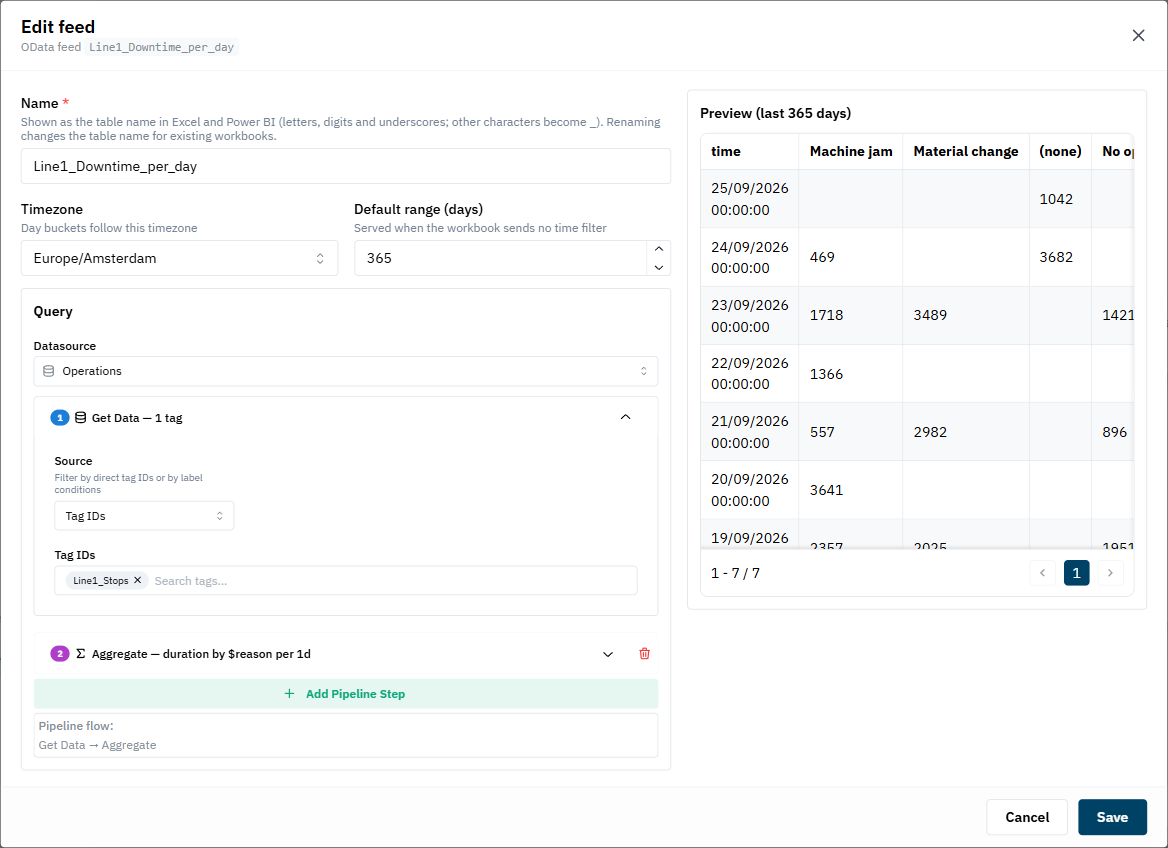
Name
The name becomes the table name in Excel and Power BI. Use letters, digits and underscores; other characters are replaced by _. For example Line1_Output_per_hour.
Renaming a feed renames the table. Existing workbooks that use the old name stop refreshing until you point them at the new table.
Timezone and default range
- Timezone — day and week buckets follow this timezone, so a “day” matches the factory day. It defaults to the organisation timezone.
- Default range (days) — the period the feed returns when the workbook asks for no specific period. For example 30: every refresh loads the last 30 days.
Query
Build the query exactly like a dashboard panel. Two datasources are available:
- Timeseries — tag values over time. The table gets a
timecolumn and one column per tag. Use a bucket (for example 1 hour) and an aggregation to keep the table a sensible size. - Operations — one row per production run or stop, with its start, end, duration, metadata and KPIs. With an aggregate step you get totals, for example downtime per reason per day.
The preview on the right shows the table exactly as Excel and Power BI will receive it.
Create
UpBlue runs the query once and stores the column names. The notification shows the table name and how many columns it has.
Build the query that answers the question, not a copy of all raw data. Output per hour for the last year is 8 760 rows; the raw counter could be millions. Excel and Power BI are fast with the first and slow with the second.
Refresh columns
The column list is fixed when you save the feed. Did you add a tag later, or rename one? Open the feed menu and choose Refresh columns. The new columns show up in Excel and Power BI at the next refresh.
Create an OData user
Excel and Power BI sign in with an OData user, not with your personal UpBlue account. This way a workbook keeps working when someone leaves the company, and a shared workbook never contains a personal password.
New user
Username
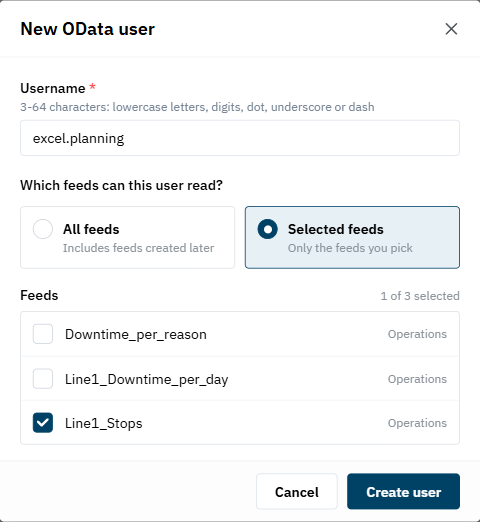
Lowercase letters, digits, dot, underscore or dash. Name it after its purpose, for example excel.finance or powerbi.production.
Access
- All feeds — the user can read every feed, including feeds created later.
- Selected feeds — only the feeds you tick.
Copy the password
The password is generated by UpBlue and shown once. Copy it into your password manager, or straight into Excel.
Lost the password? Open the user menu and choose Generate new password. The old password stops working immediately; workbooks that use it need the new one.
Use Edit access to change which feeds a user can read, and Delete to revoke it completely.
Connect from Excel
Copy the OData URL
At the top of the Excel & Power BI page, click Copy next to the OData URL. There is one URL per organisation; it lists all feeds the user may read.
Open the OData connector
In Excel: Data → Get Data → From Other Sources → From OData Feed. Paste the URL and click OK.
Sign in
Choose Basic on the left, enter the OData username and password, and apply the credentials to the URL shown. Excel remembers them for the next refresh.
Pick the tables
The Navigator shows one table per feed. Select one or more and click Load, or Transform Data to shape it first in Power Query.
From now on, Data → Refresh All fetches the latest data.
Connect from Power BI
Power BI works the same: Get Data → OData feed, paste the URL, choose Basic and sign in with the OData user.
After publishing the report to the Power BI Service, open the semantic model settings, enter the same Basic credentials under Data source credentials, and set up a scheduled refresh. No gateway is needed: UpBlue is reachable over the internet.
See the Power BI tutorial for a complete example.
Time filters and limits
Without a time filter, a feed returns its default range. To load a different period, filter the time column in Power Query (for example is after 1-1-2026). The filter is sent to UpBlue, so only the requested period is calculated and downloaded. Power BI incremental refresh on the time column works the same way.
An Operations feed without an interval has no time column. You can still filter on start in Power Query, but only within the default range: set that range long enough for your report.
Per request:
- at most 2 years of data;
- at most 500 000 rows. Larger results are split into pages of 50 000 rows, which Excel and Power BI fetch automatically.
Asking for more returns an error with the advice to narrow the time filter or use a larger bucket.
Dashboard variables ($line, $machine) do not exist in a feed; a query that uses them cannot be saved. Transformations from the dashboard panel are not available either: do them in Power Query.